• HOME2

Vitorchiano

Lazio, Italia
42.47 ° N
12.17 ° E
285 m
Macchia mediterranea
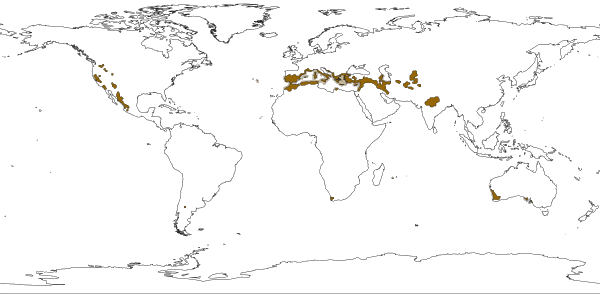
Csa Hot-summer Mediterranean climate
+
Csak Subtropical climate with dry summer with hot summer with cool winter
Traditional Koppen classification: Csa (Hot-summer Mediterranean climate)

Official definition:
  • C – temperature of warmest month greater than or equal to 10 °C and temperature of coldest month less than 18 °C, but higher than -3 °C
  • s – precipitation in the driest month during the summer half year is less than 30 mm and less than one third of the precipitation in the month with highest precipitation in the winter half year.
  • a - temperature of the warmest month is higher than 22 °C

Cs climate type is characterized by a dry summer and wet winter. In the case of the Csa subtype, the summer tends to be very warm. The average temperature of the warmest month is above 22 °C. The wettest month in the winter usually has three times as much precipitation than the driest month in the summer, which usually has less than 30 mm of rainfall. Summers are therefore quite dry, with relatively little cloudiness and often longer periods with no rain at all. Winters on the other hand are wet and very rarely it snows as well.

Temperatures in the summer reach very high values between 30 and 40 °C. In the winter it is very unusual for the temperatures to fall below freezing point.

The continental Mediterranean climate (Csa) is sometimes also referred to as hot Mediterranean climate. The higher temperatures are the result of the fact that the places are usually deeper inland. The Csa subtype is more common than the other Cs climates and usually represents what most people imagine under the term “Mediterranean climate”.

It can be found for example around the Mediterranean sea in Europe, in Southwest Australia, Southwestern part of South Africa, some parts in Central Asia and in Northern California. Other places also include some microregions such as the Spanish capital Madrid, Italian Rome, American Los Angeles or Perth in Australia.


Modern Trewartha classification: Csak (Subtropical climate with dry summer with hot summer with cool winter)

Subtropical in the Koppen and Trewartha classification is defined as a region, where at least eight months has an average temperature of more than 10 °C, but the coldest month has an average temperature of less than 18 °C. The individual subtypes then differ in their annual precipitation distribution. In Trewartha classification there is a condition of maximum annual precipitation of 900 mm.

In general the subtropical climate is usually found in areas polewards from the tropical zones. It can also be found inside tropical zones at places with higher altitude. Typical are for example citrus trees or palm trees.

The Cs subtype in the Trewartha classification represents a subtropical climate with dry summer, sometimes referred to as the Mediterranean climate. It is characterized by hot and dry summers and mild winters, during which most of the precipitation is observed. High pressure is the dominating factor in the summer, when precipitation is very small and if there is some, it is usually in the form of very short, but intense thunderstorms. In the winter it can sometimes snow, especially at higher altitudes, but in general the winters are mild.

This climate type is most common in western coasts of continents in the middle latitudes, for example it includes areas on the West coast of the U.S. such as California, Southern Europe or Southwest tip of Australia.

  • hot summer: warmest month with average temperature between 23 and 28 °C
  • cool winter: coldest month with average temperature between 0 and 10 °C

Riepilogo

14.29 °C
9.74 / 18.89

769.0 mm
67 giorni

68.83 %

5 h 10.1 min/giorno


Temperatura
+

Mese Media
1 2 3 4 5 6 7 8 9 10 11 12
Min Temperatura(°C) 2.53.04.97.511.215.017.817.414.911.17.44.2 9.7
Med Temperatura(°C) 5.56.69.012.316.520.824.023.420.115.310.87.2 14.3
Max Temperatura (°C) 8.610.213.117.121.826.730.329.525.419.614.210.2 18.9
Differenza 6.17.28.29.610.611.712.512.110.58.56.86.0 9.2


Max mese Min mese Differenza annuale
Min Temperatura Lug Gen 15.3°C
Med Temperatura Lug Gen 18.5°C
Max Temperatura Lug Gen 21.7°C
Intervallo temperatura Lug Dic 27.8°C
Mese Media
1 2 3 4 5 6 7 8 9 10 11 12
Min Temperatura(°C)
Med Temperatura(°C)
Max Temperatura(°C)


Mar, Apr, Mag

Giu, Lug, Ago

Set, Ott, Nov

Dic, Gen, Feb
Max Min Media Differenza Max Min Media Differenza Max Min Media Differenza Max Min Media Differenza
Min Temperatura 11.2 4.9 7.87 6.3 17.8 15.0 16.73 2.8 14.9 7.4 11.13 7.5 4.2 2.5 3.23 1.7
Med Temperatura 16.5 9.0 12.60 7.5 24.0 20.8 22.73 3.2 20.1 10.8 15.40 9.3 7.2 5.5 6.43 1.7
Max Temperatura 21.8 13.1 17.33 8.7 30.3 26.7 28.83 3.6 25.4 14.2 19.73 11.2 10.2 8.6 9.67 1.6

Temperatura
+

Mese Media
1 2 3 4 5 6 7 8 9 10 11 12
Med Temperatura (°C) 5.56.69.012.316.520.824.023.420.115.310.87.2 14.3


Max mese Min mese Differenza annuale
Med Temperatura Lug Gen 18.5°C
Mese Media
1 2 3 4 5 6 7 8 9 10 11 12
Med Temperatura (°C)


Mar, Apr, Mag

Giu, Lug, Ago

Set, Ott, Nov

Dic, Gen, Feb
Max Min Media Differenza Max Min Media Differenza Max Min Media Differenza Max Min Media Differenza
Med Temperatura 16.5 9.0 12.60 7.5 24.0 20.8 22.73 3.2 20.1 10.8 15.40 9.3 7.2 5.5 6.43 1.7


Umidità
+

Mese Media
1 2 3 4 5 6 7 8 9 10 11 12
Med Umidità (%) 74.071.068.069.069.066.061.062.065.071.075.075.0 14.3


Max mese Min mese Differenza annuale
Med Umidità Nov, Dic Lug 14.0%
Mese Media
1 2 3 4 5 6 7 8 9 10 11 12
Med Umidità (%)


Mar, Apr, Mag

Giu, Lug, Ago

Set, Ott, Nov

Dic, Gen, Feb
Max Min Media Differenza Max Min Media Differenza Max Min Media Differenza Max Min Media Differenza
Med Umidità 69.0 68.0 68.67 1.0 66.0 61.0 63.00 5.0 75.0 65.0 70.33 10.0 75.0 71.0 73.33 4.0


Precipitazioni
+

Mese Media mensile Totale annuale
1 2 3 4 5 6 7 8 9 10 11 12
Precipitazione media mensile (mm) 65.066.057.063.054.053.028.048.068.087.0101.079.0 64.1 769.0
Giorni di pioggia 666854235787 6 67
Giorni di pioggia quantità (%) 19.4
6,25
21.4
6,22
19.4
6,25
26.7
8,22
16.1
5,26
13.3
4,26
6.5
2,29
9.7
3,28
16.7
5,25
22.6
7,24
26.7
8,22
22.6
7,24
18.4
18.41095890411,81.58904109589


Max mese Min mese Max Stagione Min Stagione Differenza annuale
Precipitazione media mensile Nov Lug Autunno Estate 73.0mm
Giorni di pioggia Apr, Nov Lug Autunno Estate 6
Mese
1 2 3 4 5 6 7 8 9 10 11 12
Precipitazione media mensile (mm)
Giorni di pioggia / mese


Mar, Apr, Mag

Giu, Lug, Ago

Set, Ott, Nov

Dic, Gen, Feb
Max Min Differenza Totale Max Min Differenza Totale Max Min Differenza Totale Max Min Differenza Totale
Precipitazione media mensile (mm) 63.0 54.0 9.0 174.0 53.0 28.0 25.0 129.0 101.0 68.0 33.0 256.0 79.0 65.0 14.0 210.0
Giorni di pioggia 8 5 3 19 4 2 2 9 15 5 10 31 7 6 1 19

Precipitazioni
+

Mese Media mensile Totale annuale
1 2 3 4 5 6 7 8 9 10 11 12
Precipitazione media mensile (mm) 65.066.057.063.054.053.028.048.068.087.0101.079.0 64.1 769.0


Max mese Min mese Max Stagione Min Stagione Differenza annuale
Precipitazione media mensile Nov Lug Autunno Estate 73.0mm
Mese
1 2 3 4 5 6 7 8 9 10 11 12
Precipitazione media mensile (mm)


Mar, Apr, Mag

Giu, Lug, Ago

Set, Ott, Nov

Dic, Gen, Feb
Max Min Differenza Totale Max Min Differenza Totale Max Min Differenza Totale Max Min Differenza Totale
Precipitazione media mensile (mm) 63.0 54.0 9.0 174.0 53.0 28.0 25.0 129.0 101.0 68.0 33.0 256.0 79.0 65.0 14.0 210.0


Luce del giorno / Lunghezza del giorno
+

Average daily sunlight Average day length Max lunghezza del giorno Min lunghezza del giorno Luce del giorno/Lunghezza del giorno
Gen 102 min
1 h 42 min
567 min
9 h 27 min
567,873
595 min
9 h 55 min
(31.1.)
595,845
547 min
9 h 7 min
(1.1.)
547,893
18.0 %
102,465
Feb 174 min
2 h 54 min
633 min
10 h 33 min
633,807
672 min
11 h 12 min
(29.2.)
672,768
598 min
9 h 58 min
(1.2.)
598,842
27.5 %
174,459
Mar 284 min
4 h 44 min
718 min
11 h 58 min
718,722
761 min
12 h 41 min
(31.3.)
761,679
674 min
11 h 14 min
(1.3.)
674,766
39.6 %
284,434
Apr 368 min
6 h 8 min
804 min
13 h 24 min
804,636
842 min
14 h 2 min
(30.4.)
842,598
764 min
12 h 44 min
(1.4.)
764,676
45.8 %
368,436
Mag 468 min
7 h 48 min
877 min
14 h 37 min
877,563
903 min
15 h 3 min
(31.5.)
903,537
845 min
14 h 5 min
(1.5.)
845,595
53.4 %
468,409
Giu 524 min
8 h 44 min
914 min
15 h 14 min
914,526
917 min
15 h 17 min
(20.6.)
917,523
905 min
15 h 5 min
(1.6.)
905,535
57.4 %
524,390
Lug 530 min
8 h 50 min
894 min
14 h 54 min
894,546
913 min
15 h 13 min
(1.7.)
913,527
868 min
14 h 28 min
(31.7.)
868,572
59.3 %
530,364
Ago 478 min
7 h 58 min
830 min
13 h 50 min
830,610
866 min
14 h 26 min
(1.8.)
866,574
791 min
13 h 11 min
(31.8.)
791,649
57.6 %
478,352
Set 384 min
6 h 24 min
747 min
12 h 27 min
747,693
788 min
13 h 8 min
(1.9.)
788,652
706 min
11 h 46 min
(30.9.)
706,734
51.4 %
384,363
Ott 232 min
3 h 52 min
661 min
11 h 1 min
661,779
703 min
11 h 43 min
(1.10.)
703,737
621 min
10 h 21 min
(31.10.)
621,819
35.1 %
232,429
Nov 98 min
1 h 38 min
586 min
9 h 46 min
586,854
618 min
10 h 18 min
(1.11.)
618,822
558 min
9 h 18 min
(30.11.)
558,882
16.7 %
98,488
Dic 79 min
1 h 19 min
547 min
9 h 7 min
547,893
557 min
9 h 17 min
(1.12.)
557,883
543 min
9 h 3 min
(21.12.)
543,897
14.5 %
79,468
Anno 336 min
5 h 36 min
732 min
12 h 12 min
732,708
917 min
15 h 17 min
(19. 6.)
917,523
543 min
9 h 3 min
(20. 12.)
543,897
45.9 %
336,396


Mar, Apr, Mag

Giu, Lug, Ago

Set, Ott, Nov

Dic, Gen, Feb
Max Min Media Luce del giorno/giorno Max Min Media Luce del giorno/giorno Max Min Media Luce del giorno/giorno Max Min Media Luce del giorno/giorno
Average sunlight (min/giorno) 468 284 373 46.7%
373,426
530 478 511 58.1%
511,368
384 98 238 35.8%
238,427
174 79 118 20.4%
118,463
Lunghezza del giorno 903 674 799 917 791 879 788 558 665 672 543 581

Lunghezza del giorno
+

Average day length Max lunghezza del giorno Min lunghezza del giorno
Gen 567 min
9 h 27 min
567,873
595 min
9 h 55 min
(Array.1.)
595,845
547 min
9 h 7 min
(1.1.)
547,893
Feb 633 min
10 h 33 min
633,807
672 min
11 h 12 min
(Array.2.)
672,768
598 min
9 h 58 min
(1.2.)
598,842
Mar 718 min
11 h 58 min
718,722
761 min
12 h 41 min
(Array.3.)
761,679
674 min
11 h 14 min
(1.3.)
674,766
Apr 804 min
13 h 24 min
804,636
842 min
14 h 2 min
(Array.4.)
842,598
764 min
12 h 44 min
(1.4.)
764,676
Mag 877 min
14 h 37 min
877,563
903 min
15 h 3 min
(Array.5.)
903,537
845 min
14 h 5 min
(1.5.)
845,595
Giu 914 min
15 h 14 min
914,526
917 min
15 h 17 min
(Array.6.)
917,523
905 min
15 h 5 min
(1.6.)
905,535
Lug 894 min
14 h 54 min
894,546
913 min
15 h 13 min
(Array.7.)
913,527
868 min
14 h 28 min
(31.7.)
868,572
Ago 830 min
13 h 50 min
830,610
866 min
14 h 26 min
(Array.8.)
866,574
791 min
13 h 11 min
(31.8.)
791,649
Set 747 min
12 h 27 min
747,693
788 min
13 h 8 min
(Array.9.)
788,652
706 min
11 h 46 min
(30.9.)
706,734
Ott 661 min
11 h 1 min
661,779
703 min
11 h 43 min
(Array.10.)
703,737
621 min
10 h 21 min
(31.10.)
621,819
Nov 586 min
9 h 46 min
586,854
618 min
10 h 18 min
(Array.11.)
618,822
558 min
9 h 18 min
(30.11.)
558,882
Dic 547 min
9 h 7 min
547,893
557 min
9 h 17 min
(Array.12.)
557,883
543 min
9 h 3 min
(21.12.)
543,897
Anno 732 min
12 h 12 min
732,708
917 min
15 h 17 min
(21. 6.)
917,523
543 min
9 h 3 min
(22. 12.)
543,897


Mar, Apr, Mag

Giu, Lug, Ago

Set, Ott, Nov

Dic, Gen, Feb
Max Min Media Max Min Media Max Min Media Max Min Media
Lunghezza del giorno 903 674 799 917 791 879 788 558 665 672 543 581


Unità

Lingua


Per qualsiasi tipo di aiuto o supporto cliccare su "informazioni".

Icone


Temperatura

Umidità

Pressione

Velocità del vento

Raffica di vento

Precipitazioni

Radiazione solare

Neve

Temperatura apparente

Punto di rugiada

UV

Visibilità

Base nuvolosa

Evapotraspirazione

Temperatura interna

Umidità interna


Alba

Tramonto

Alba lunare

Tramonto lunare

Time

Menu

Dal

Al

Schermo intero

Esporta come immagine

Impostazioni

Homepage

Webcam

Tabella

Grafico

Mappa

Costante

Aumento

Diminuzione

Avviso

Latitudine

Longitudine

Cronologia

Eclissi solare

Eclissi di luna

GPS

Elevazione

Giorno

Mese

Anno

Alta temperatura

Bassa temperatura

Giorno

Notte

Primavera

Estate

Autunno

Inverno